Monday, December 25, 2006
Pf tracing results
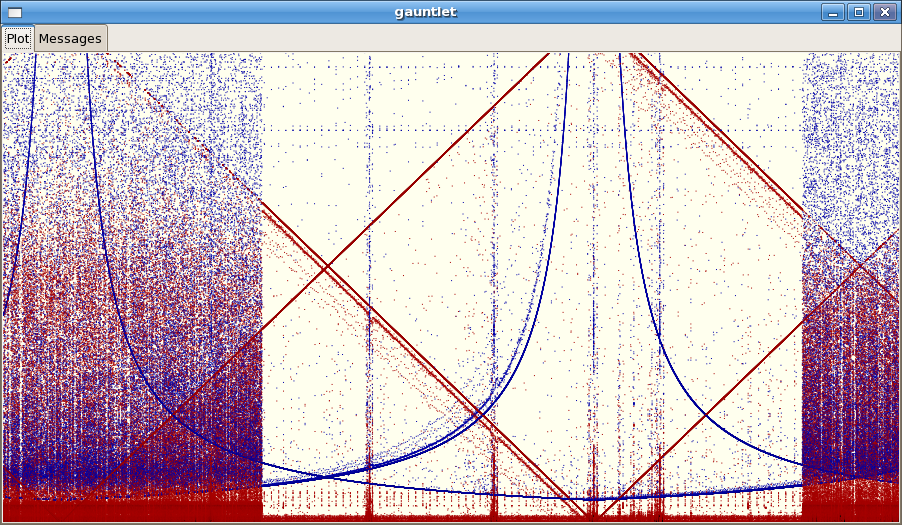
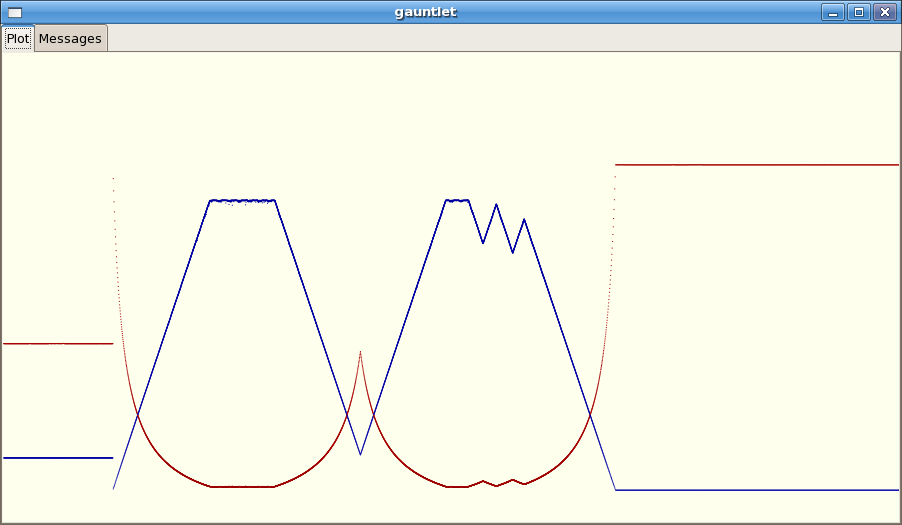
Pf.gaunlet is now able to make plots of "intervals" and "speed". "An interval" is the count of CPU cycles between two consequent interrupt events. "Speed" is determined as (1 / interval), it is plotted with blue color, while "intervals" are plotted with brown.
On the first screenshot you can see a plot that was made for all interrupt events in the system. The noise at the left is the result of my system being a samba file server, somebody was downloading a movie at the moment. A bit of idle time follows, and then another download had began according to smbstatus output. Bold crossing lines are the result of local APIC timer and i8253 PIT timer being set for almost the same frequency, with a slight difference due to different clock sources of these timers.
The second plot is for a real-time interrupt only. I was performing fast manual movements at that time. The plot shows linear speed increasing (constant acceleration). At the top speed (5Khz frequency in this case) some noise is noticeable, that's how "2.6.19-mync" kernel performs. The worst-case interrupt latency seems to be around 25 microseconds, which is a usual limit for PC hardware.
# posted by erdizz @ 6:33 AM 
![]()