Monday, June 05, 2006
Performance tuning

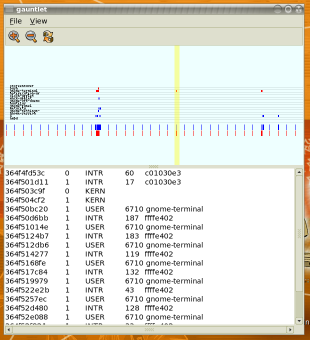
I've just put a bit of love into Performance. Here is the screenshot of performance.gauntlet. I take the trace with the following commands:
echo 1 > /proc/performance/enable
# Do something special
echo 0 > /proc/performance/enable
cp /proc/performance/trace ./
gauntlet trace
Copying from proc is required because gauntlet mmaps the file and procfs doesn't support mmap. I'm looking forward to some better way of accessing trace data that would allow direct mmap without copying.
Then gauntlet window appears where the trace is displayed in a timeline horizontally and can be moved and zoomed. A thick yellow marker line follows mouse pointer and in a text field at the bottom there is a list of events covered by the marker. It's quite convinient. The only thing left is to add some heuristics to determine bad high-latency places and to highlight them.